
AB Test Calculator — Compare two populations
Welcome to the AB test calculator . Made a new miracle drug and need to decide if it works? Want to see if your website’s new feature gets you more clicks? Or just want to see who is the best driver out of men and women? An AB test can answer all these questions and more with the power of two-proportion statistical significance . Here, we’ll show you what an AB test is and how to calculate statistical significance for two populations so that you can see if you’ve found a significant difference .
Let’s consider an AB test in a more statistical environment. An AB test (also known as a split test or a two-proportion statistical significance test ) is a form of Z-test . Our Z-test’s null hypothesis (the default assumption) is that the two proportions are the same. We want to prove the null hypothesis wrong; we want to prove that there is a difference!
An AB test is a statistical significance test in which two populations are compared to see if they differ significantly on a single characteristic .
An outcome of an experiment has statistical significance when it has occurred despite being highly unlikely . You flipped a coin 100 times and got 60 heads where you expected 50 heads — is your coin unfairly biased towards heads, or did you just get lucky with your flips? Statistical significance can be helpful when you must decide whether a result you’ve obtained through your experiment is really due to an underlying factor (your coin really is biased) or due to chance or error in your sampling (you just got lucky).
How to determine two-proportion statistical significance
Remember, we want to disprove the null hypothesis stating that our populations do not differ on our specified characteristic. We first have to choose a suitable confidence interval — the probability of accepting the null hypothesis when it is true. The most commonly used confidence level is 95%, but you can use any percentage. Our calculator supports confidence levels of 90%, 95%, 98%, and 99%. We have to subtract our confidence level from 100% to get the alpha level, which is the probability of rejecting the null hypothesis when the null hypothesis is false. We also have to go one step further and divide our alpha level by two since we’re performing a two-tailed Z-test. Take a look at the image below:
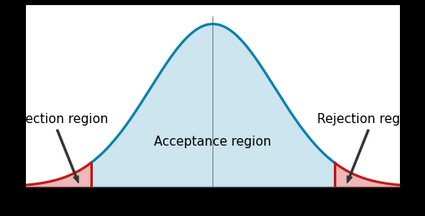 The acceptance and rejection regions on a normal distribution.
A split test works by determining the Z-score of the two-population problem and determining whether it falls into the acceptance region (the blue segment) or the rejection region (the red segments) of the normal distribution. If it falls into the acceptance region, we must accept the null hypothesis. If it falls into the rejection region, we can reject the null hypothesis. You can see in the figure above that the rejection region is much smaller than the acceptance region. This difference in size might make it hard to disprove the null hypothesis, but if you do end up disproving it, it’s undeniably false.
To perform a two-proportion Z-test, start with your two populations. Determine their sample sizes (n1n_1n1 and n2n_2n2) and the number of positive results in each group (t1t_1t1 and t2t_2t2). You can now calculate your population’s proportions p1=t1/n1p_1 = t_1/n_1p1=t1/n1 and p2=t2/n2p_2 = t_2/n_2p2=t2/n2, as well as the overall sample proportion,
p=t1+t2n1+n2\small p = \frac{t_1+t_2}{n_1+n_2}
p
=
n
1
+
n
2
t
1
+
t
2
Then you can calculate your Z-score as follows:
Z=p1−p2p⋅(1−p)⋅(1/n1+1/n2)\small Z = \frac{p_1-p_2}{\sqrt{p\cdot(1-p)\cdot(1/n_1+1/n_2)}}
Z
=
p
⋅
(
1
−
p
)
⋅
(
1/
n
1
+
1/
n
2
)
p
1
−
p
2
The choice of confidence level determines the alpha level’s Z-score Zα/2Z_{\alpha/2}Zα/2, which is what you’re going to compare to your Z-score ZZZ. You can find the alpha level’s Z-score for your chosen confidence level from this table:
Confidence level
Alpha level α\alphaα
Alpha level’s Z-score Zα/2Z_{\alpha/2}Zα/2
90%
10%
1.645
95%
5%
1.96
98%
2%
2.326
99%
1%
2.576
Now that you have both your Z-score and the alpha level’s Z-score, you can take the last step and compare them. If your Z-score’s magnitude is larger than your alpha level’s Z-score (that is, if ∣Z∣>∣Zα/2∣\vert Z\vert > \vert Z_{\alpha/2} \vert∣Z∣>∣Zα/2∣), then you can reject the null hypothesis – your results are statistically significant. If ∣Z∣<∣Zα/2∣\vert Z\vert < \vert Z_{\alpha/2} \vert∣Z∣<∣Zα/2∣, you must admit defeat and accept the null hypothesis — your populations are too similar to warrant any excitement.
To summarise the process:
- Calculate your Z-score
ZZ
Z
with the populations’ data.
- Pick a confidence level and get
Zα/2Z_{\alpha/2}
Z
α
/2
from the handy table.
- Compare
ZZ
Z
with
Zα/2Z_{\alpha/2}
Z
α
/2
:
- If
∣Z∣<∣Zα/2∣\vert Z\vert < \vert Z_{\alpha/2} \vert
∣
Z
∣
<
∣
Z
α
/2
∣
, accept the null hypothesis.
- If
∣Z∣>∣Zα/2∣\vert Z\vert > \vert Z_{\alpha/2} \vert
∣
Z
∣
>
∣
Z
α
/2
∣
, reject the null hypothesis.
- If


