
Benchmarking the Apple M1 Max
Mục Lục
Introduction
I recently got a 2021 16″ M1 Max MacBook Pro. It’s amazing for day-to-day use, but I was curious about the actual capabilities of the SOC. Benchmarking is a complex task, and there are plenty of outlets like Anandtech that have comprehensively done different benchmarks. However, I still had questions, so here I am with some (casual) benchmarks that I hope add some additional perspective into interesting hardware capabilities on the M1 Max SOC, just for fun and out of my curiosity.
P.S. Benchmarking is complex with many different methodologies and configurations, and I am under no delusion that what I have come up with is the best way to do things. Constructive feedback is welcome!
CPU
The CPU in the M1 Max is a 10-core CPU, with 2 efficiency cores at 2.1 GHz and 8 performance cores at 3.0 GHz during all-core load. There should be no difference between the CPU performance on the M1 Max and M1 Pro, barring slightly higher memory bandwidth available to the CPU complex on the M1 Max. As a reference point for comparison purposes, I have my desktop AMD Ryzen 5600X CPU with DDR4 memory and not overclocked. The desktop is running Ubuntu 20.04.
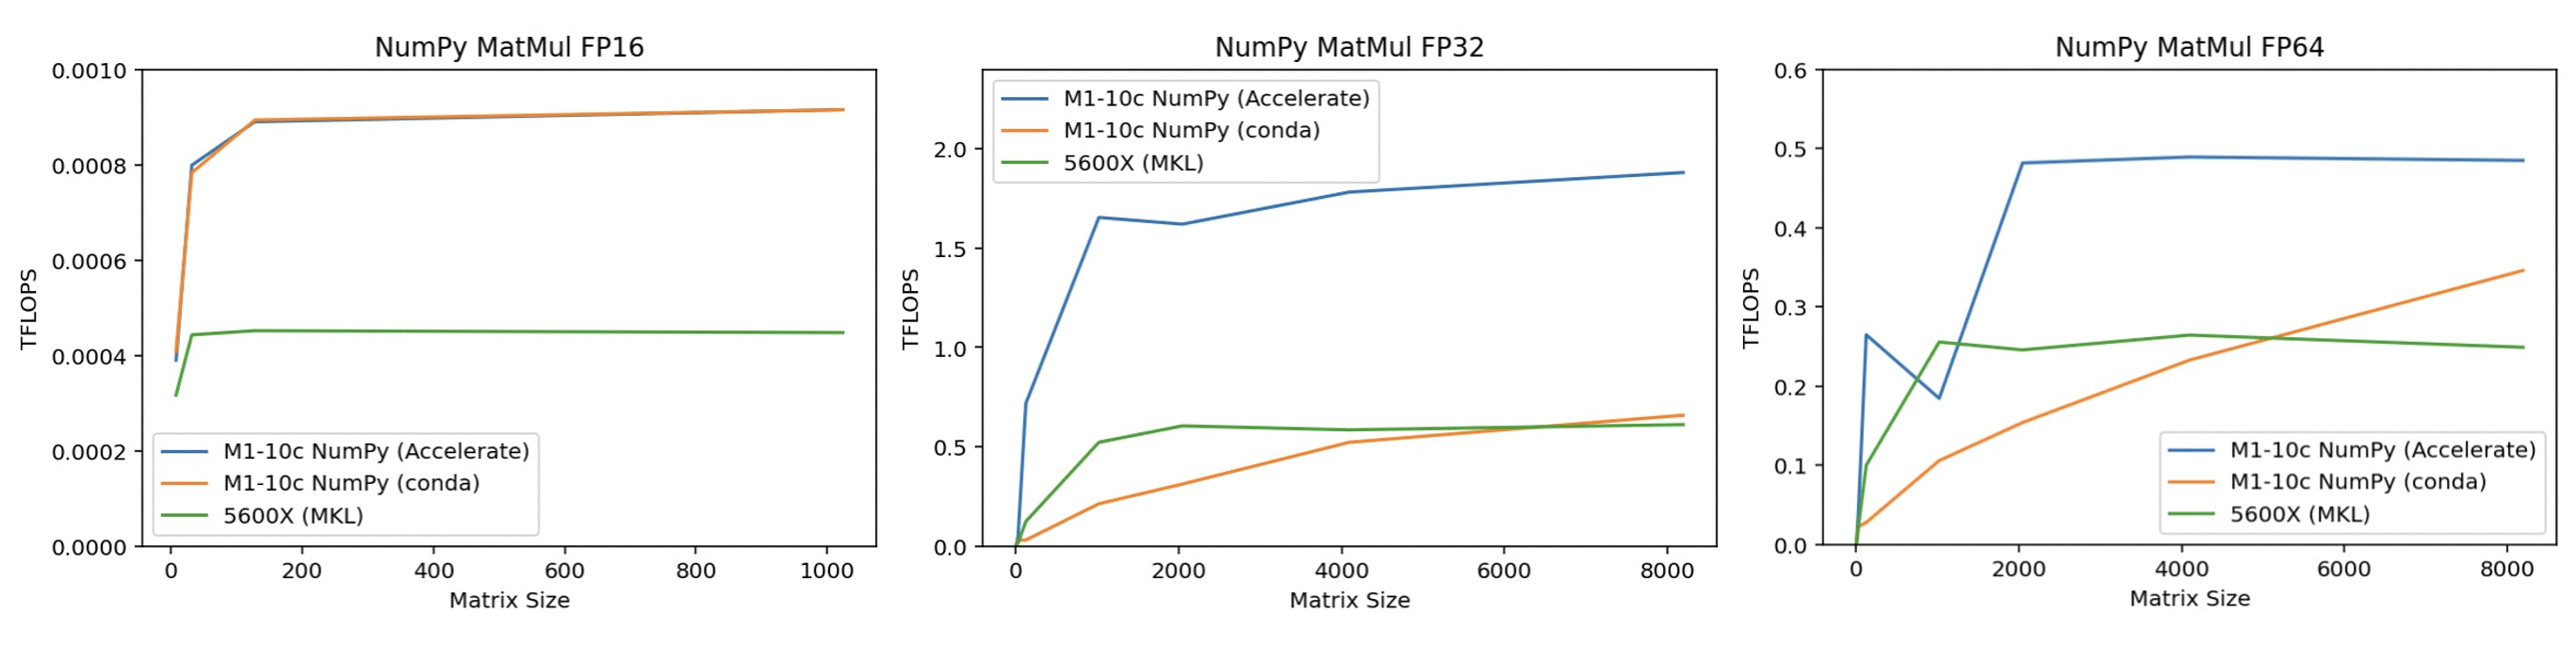
Matrix Multiplication (GEMM) Performance
We already know that the M1 Max CPU should have really strong matrix multiplication performance due to Apple’s “hidden”/undocumented AMX co-processor embedded in the CPU complex, and that it is leveraged when you use Apple’s Accelerate framework. What I didn’t know is that you can compile NumPy to work with Accelerate, which allows you to easily leverage the AMX instructions via normal NumPy code (NumPy installed via conda does not include Accelerate support, and instead uses cblas). The results are quite stunning, especially for single precision, or FP32 (which is commonly used in machine learning applications), giving us about almost 2 TFLOPS for large enough matrix sizes (about the level of a GTX 1050 Ti). Mind you, this is via normal Python NumPy code. Presumably, if you use Accelerate directly via a lower-level language, you can get even better performance. Compared to the 5600X, the M1 Max CPU is generally at least 2x faster any data type and any matrix size, even with MKL enabled on the 5600X.
Other NumPy Benchmarks
Of course, GEMM is not all. For other common NumPy functions, the differences while benchmarking are not as dramatic. Tested functions include random number generation, special functions (exp/trigo/log/power), statistical (mean/median/std), vector multiplication, SVD, and more.
(Execution timings for function reported, lower is better)
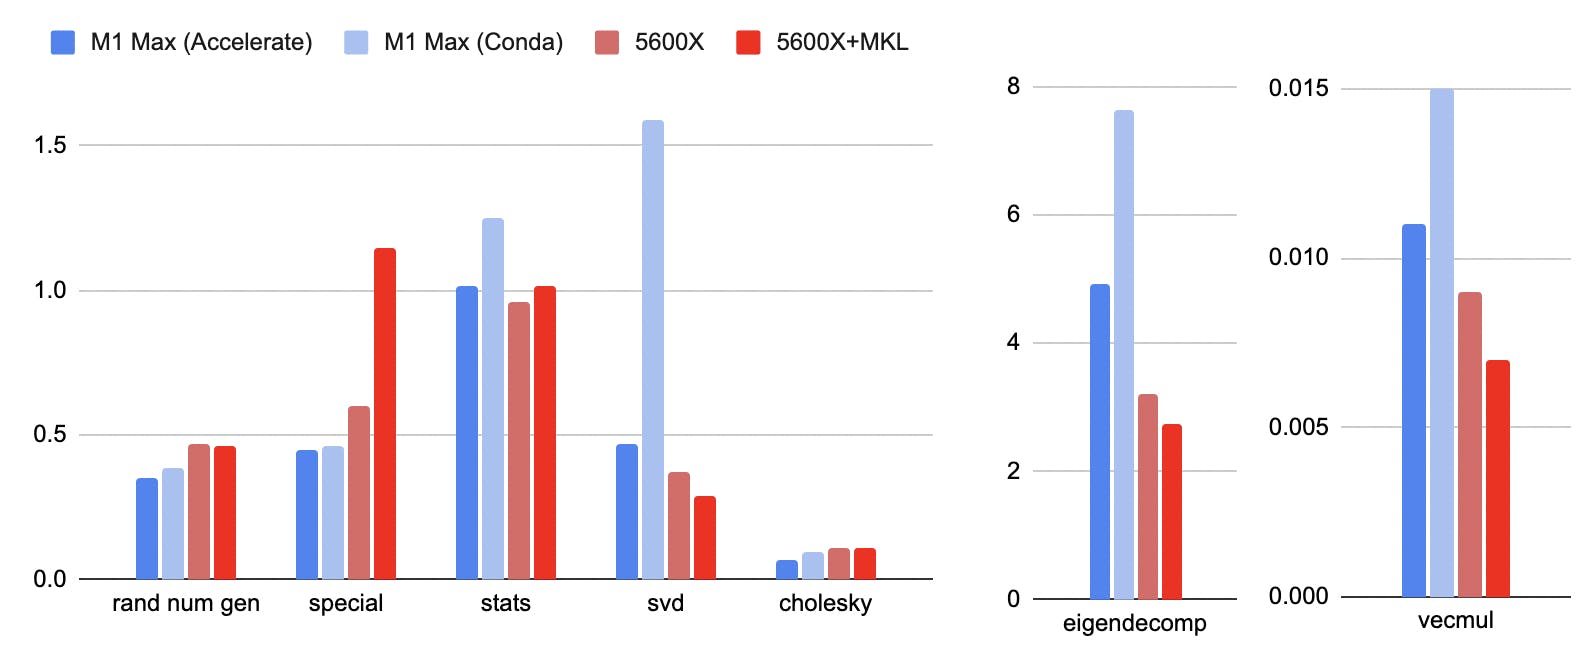
Out of the 7 tasks tested:
- M1 Max, with Accelerate, is faster on 3 tasks (RNG, special, Cholesky)
- Both are about the same on 1 task (stats)
- 5600X, with MKL is faster on 3 tasks (SVD, VecMul, eigendecomp)
Python Performance
In general, Python runs really fast on the M1 Max. Here, the PyPerformance benchmark, an official suite of real-world Python application benchmarks. Overall, the M1 Max is about 70% faster than the 5600X.
(Execution timings reported, lower is better)
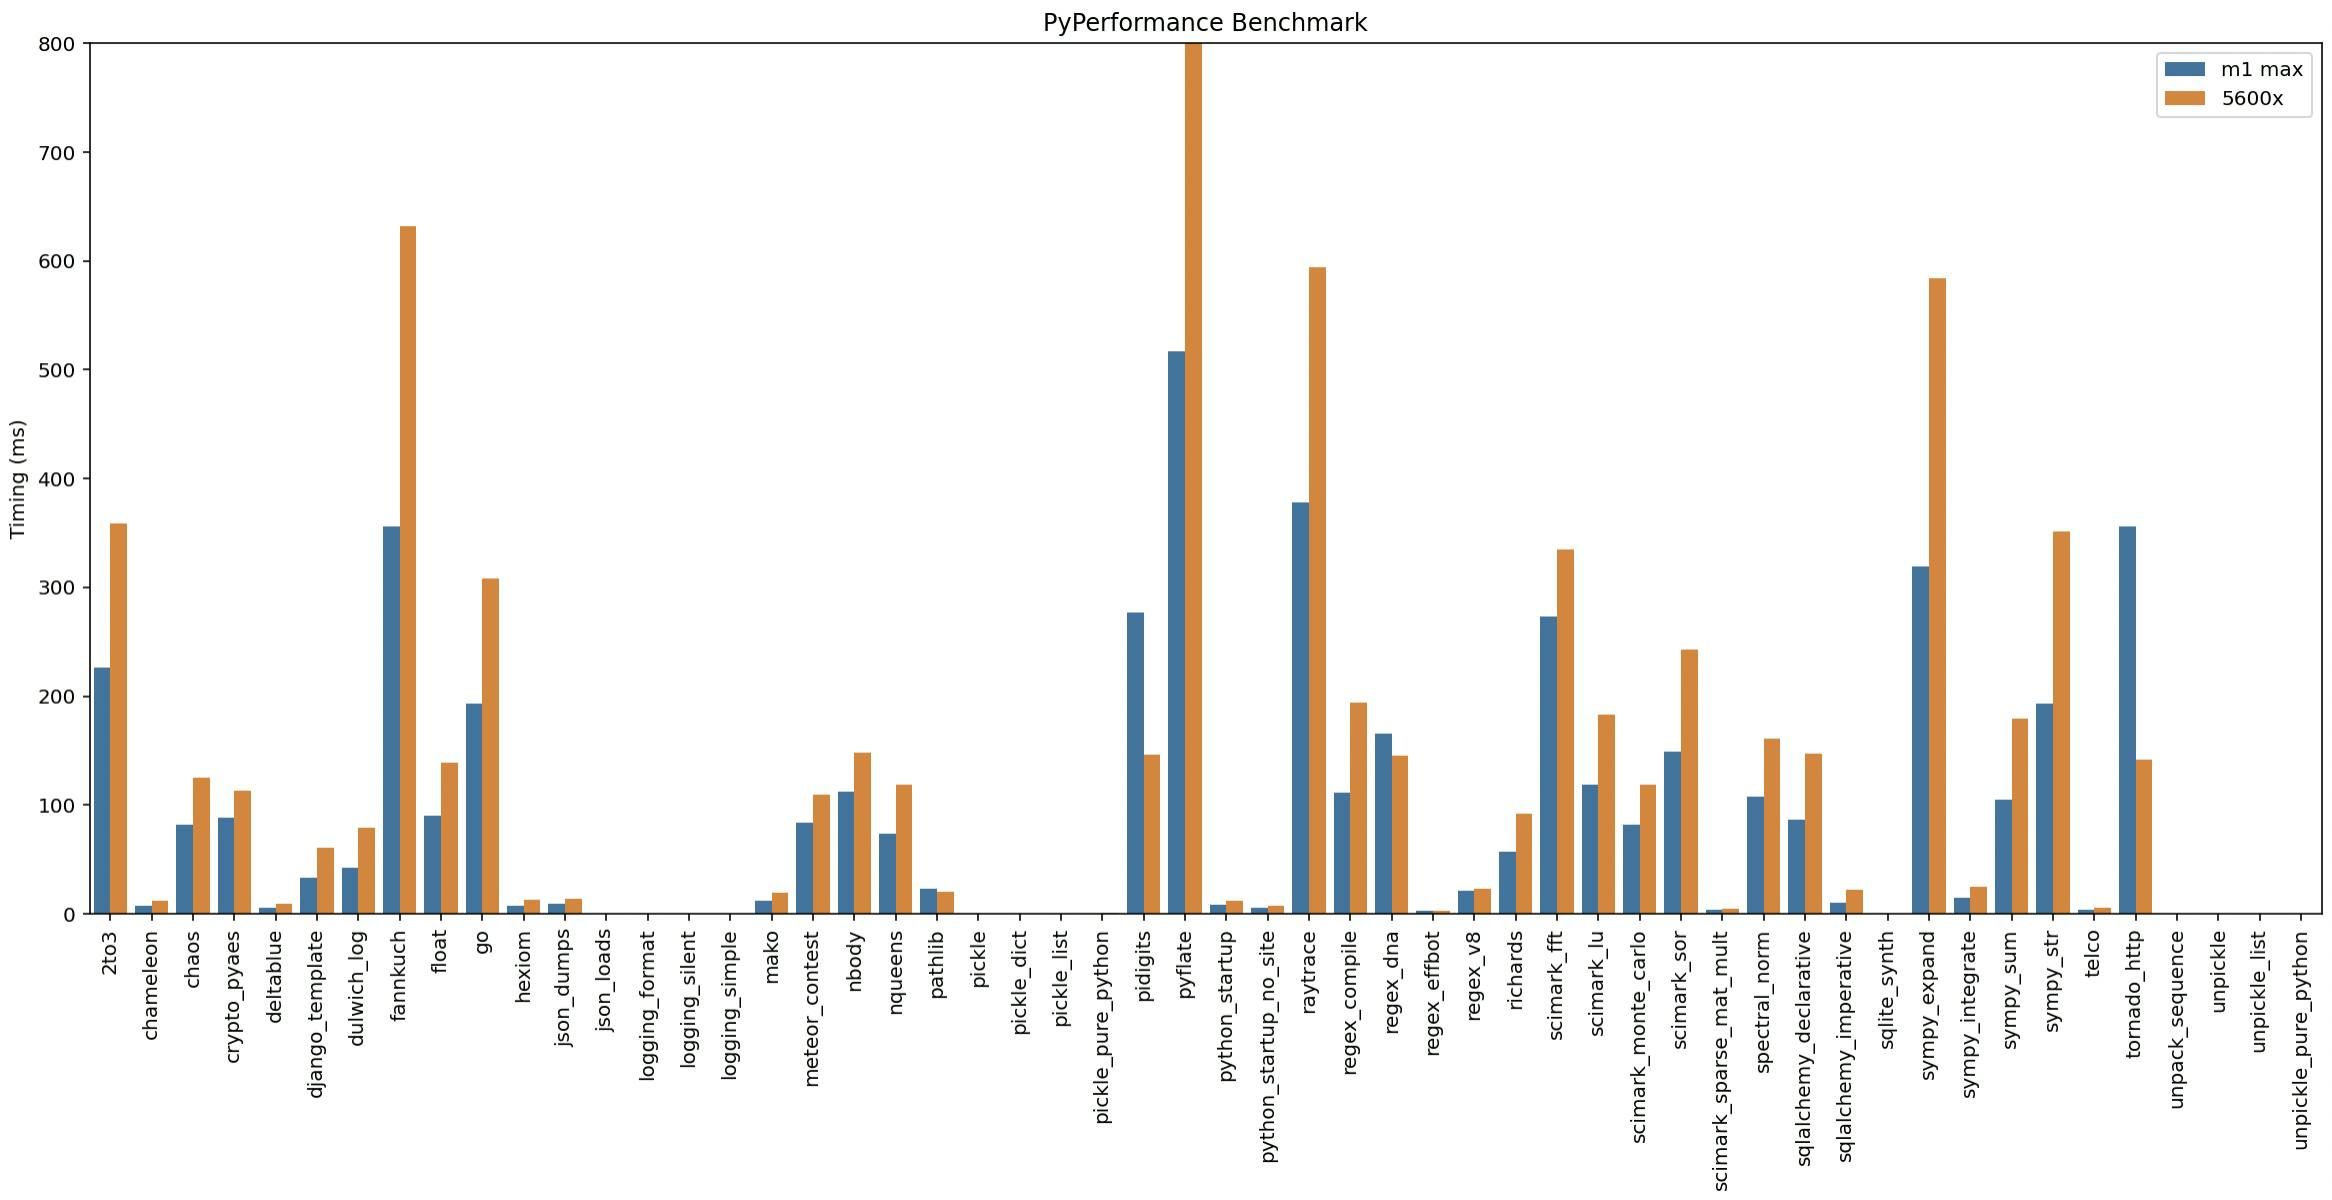
Notable exceptions where the 5600X is significantly faster:
- pidigits (generate digits of Pi)
- Tornado HTTP server
SpaCy NLP models
For the execution of SpaCy NLP models, the M1 is generally faster than 5600X, even with MKL! On M1 Max, having Accelerate via NumPy doesn’t seem to affect anything, except for the PyTorch-based Transformer model which does seem to be affected by NumPy performance. Installing SpaCy’s AppleOps package which allows SpaCy to directly call Accelerate, resulting in a dramatic performance improvement.
(Tokens/second reported, higher is better)
configen_core_web_smen_core_web_mden_core_web_lgen_core_web_trf
M1 Max (conda)314328992853309
M1 Max (NumPy+Accelerate)3191289929001064
M1 Max (AppleOps)1729516772166701121
5600X958087488773487
5600X + MKL1389512843129161107
Pandas
(Execution timings reported in seconds, lower is better)
TaskM1 Max5600X
datagen3.23.4
inner_merge17.627.4
outer_merge27.641.9
outer_merge is single-thread only, while the rest were run with the optimal number of threads tested:
- 5600X: 2 threads was the fastest (tested 1, 2, 4, 6, 12)
- M1: 10 threads was the fastest (tested 1, 2, 8, 10)
This benchmark appears to be almost entirely memory-bound, which is why adding more cores on the 5600X does not help (2 cores are enough to maximize memory bandwidth), while 10 cores on the M1 Max is the optimal configuration (while also being the configuration giving the highest memory bandwidth). You can look at the memory-related benchmarks in the Memory section. Thus, I hypothesize that the main feature of the M1 Max that is working in its favor is its much higher memory bandwidth, even in a single-core configuration.
GPU
I have the version of M1 Max with the 32-core GPU (Apple G13X, Metal GPUFamily Apple 7), running at 1.2 GHz and apparently max power consumption of about 60W. In general, I ran the benchmarks with High Power Mode enabled and on AC power, although after some testing this does not seem to affect the benchmarks in any way.
One interesting thing I noticed early on is that the system reports the idle frequency of the GPU to be very, very low, at single-digit MHz, something which I have never observed. This is likely due to some clever clock-gating design on the M1 Max SOC, which allows for low power draw by idle components of the SOC by individually clocking them much lower than the rest of the SOC.
In terms of programmability, you can use Metal, but I took the easier approach by using TensorFlow, using Apple’s Metal device plugin. The process to set it up was surprisingly painless, and it allowed me to use the GPU compute capabilities via Python.
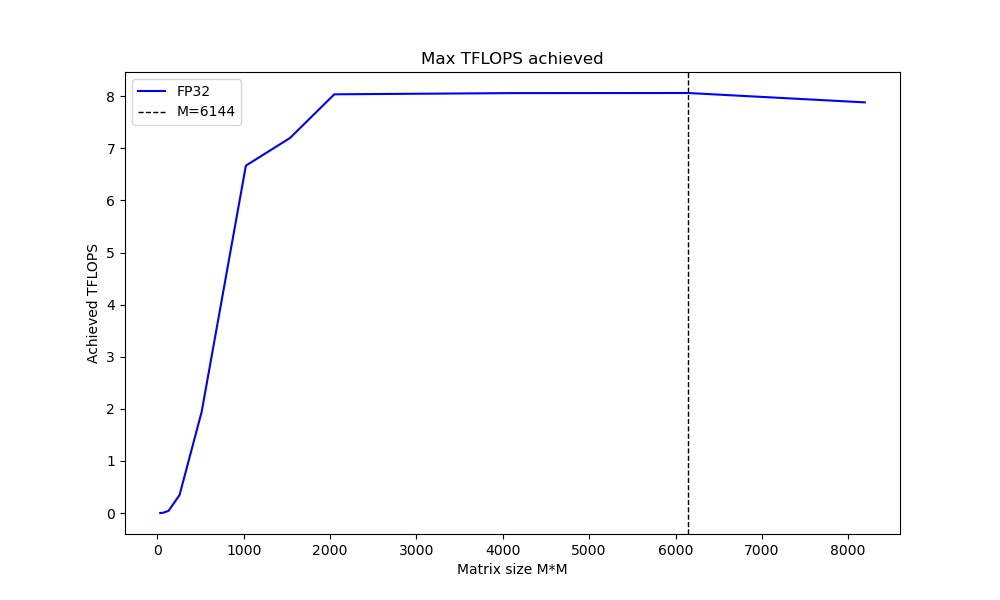
GPU Matrix Multiplication (GEMM) Performance
Because TensorFlow works, we can use it for a general Matrix Multiplication benchmark as well. It seems we can get about 8 TFLOPS from the GPU pretty easily via TensorFlow.
TensorFlow Training
The GPU on the M1 Max is also very usable for training deep learning models.
ModelGPUBatchSizeThroughput
ResNet50M1 Max 32c128140 img/sec
MobileNetV2M1 Max 32c128352 img/sec
DistilBERTM1 Max 32c64120 seq/sec
BERTLargeM1 Max 32c1619 seq/sec
How does that compare to a desktop RTX 3090 (400W power limit)?
ModelGPUBatchSizeThroughput
Same Batch Size as M1
ResNet5030901281100 img/sec
MobileNetV230901282001 img/sec
DistilBERT3090641065 seq/sec
BERTLarge309016131 seq/sec
Larger Batch Size
ResNet5030902561185 img/sec
MobileNetV230902562197 img/sec
DistilBERT30902561340 seq/sec
BERTLarge309064193 seq/sec
Pretty much what we would expect, with the M1 Max having about 8x less performance, but at 8x less power, so performance per watt is surprisingly quite comparable between the two. Power observed for M1 Max GPU was 35-42W, versus 335-380W on the 3090. Note the 3090’s software stack is much more mature, allowing the use of the XLA compiler and Tensor Cores.
Performance at different power levels
Because I saw some discussion on the matter, I decided to attempt to investigate the performance difference at different power levels for the M1 Max and 3090.
- M1 Max: only high power (aka normal <60W) and low power (~15W apparently) modes
- 3090: power limit set with nvidia-smi, no tuning of clocks/voltages etc

Important note: a trend line is added to the M1 Max data points on the graph. I don’t think it’s a scientific way to predict M1 Max performance if we could actually unlock the power limit etc. but it is a visual aid to see how it lines up, potentially.
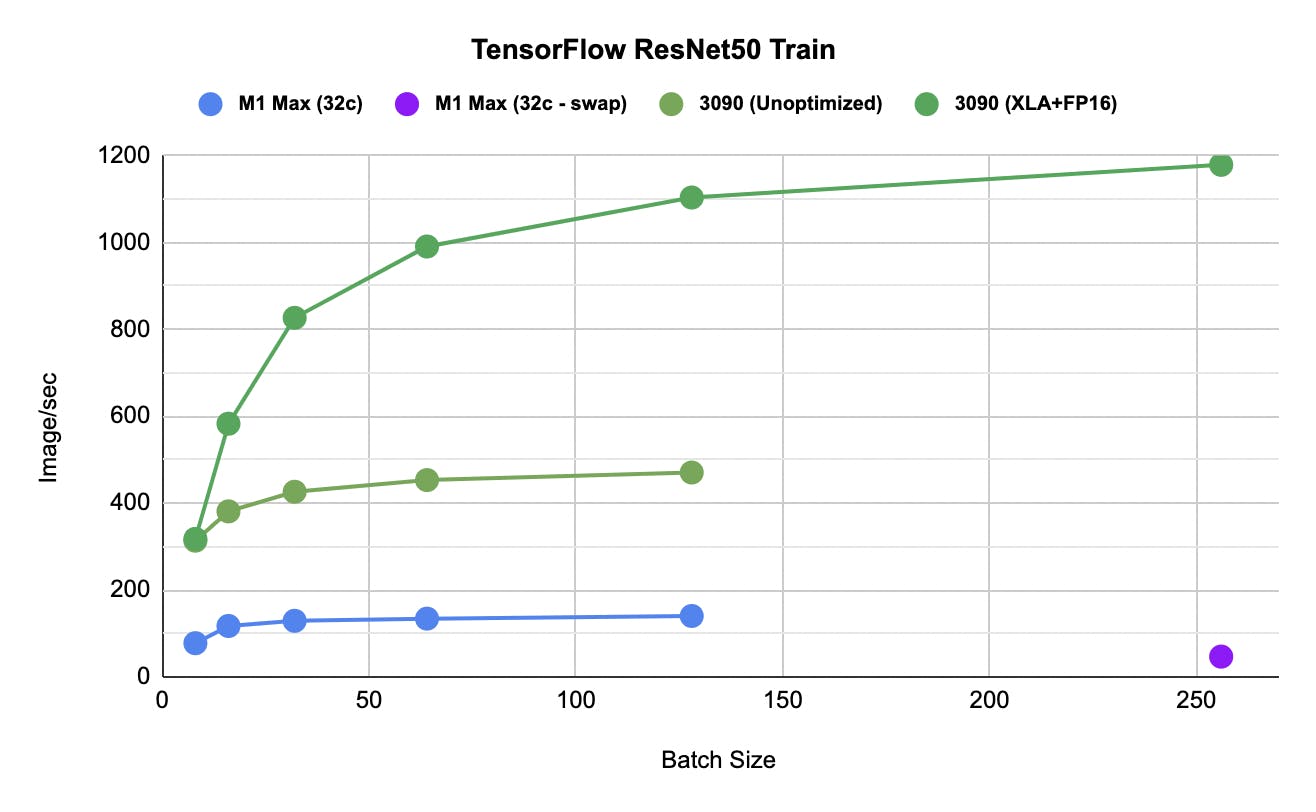
Performance at different batch size
Similarly, here is some investigation of how the training performance is at different batch sizes. The 3090 is at stock settings, M1 Max with high power mode. At batch size 256, the M1 Max (32GB) started to use swap, and the performance to about 1/3. Presumably, if we could use FP16 for GPU (may or may not come in future SW update), this will be less of an issue, since 3090 (24GB) trains at FP16 just fine.
Neural Engine
One especially interesting component I wanted to play around with was the 16-core Apple Neural Engine (ANE), which is a bit of an undocumented enigma. We can easily use it via Python by using Apple’s coremltools Python library, which can be used to convert models to Apple’s MLProgram format, and also call inference on the ANE. I needed to build the library from source for the inference to work, but model conversion worked with the pip install.
According to Apple, ANE delivers 11TOPS at what presumably is INT8 performance, although we do not have access to call INT8 operations (CoreML currently only exposes FP16 ops on the ANE). Thus, we can assume a maximum of 5.5 TFLOPS FP16 on the ANE. This would be the same across A14/M1/M1 Pro/M1 Max as they have the same 16-core ANE. From our benchmarks below, we can achieve 5.1-5.3 TFLOPS FP16.
One important caveat here is that you cannot force a CoreML model to run on the ANE, you can only specify CPU, CPU/GPU, or CPU/GPU/ANE constraints. Hence, sometimes your model might run on the GPU instead of the ANE, and you cannot control this decision made by CoreML. We will see this happen for large batch sizes in the ResNet50 benchmark later.
Matrix Multiplications
How do we execute Matrix Multiplications on the ANE? My simple method is to bunch up a few of them and export it as a TensorFlow model. (It works!) It is important to stack many MatMuls in a single model call, as there is an overhead of calling the inference operation on the ANE, and if you call it once for every MatMul, the performance is very bad!
With a stack of 20 2048×2048 MatMuls, we get about 5.1 TFLOPS FP16. Not bad!
Convolutions
For a more “real-world” benchmark, we execute a stack of convolution operations, similar to the MatMul benchmark. Why not use a real model, such as ResNet-50? The short answer is, I can more reliably compute the FLOPS from a simple stack of convolutions, and it is sufficient to satisfy my curiosity.
With a stack of 50 layers of 256 3×3 Conv2D filters, and input image size of 512×512, we get about 5.3 TFLOPS FP16. Seems about right too.
ResNet50 Inference
Using CoreML, I ran ResNet50 inference at various batch sizes, and compared the ANE to the 32-core GPU as well.
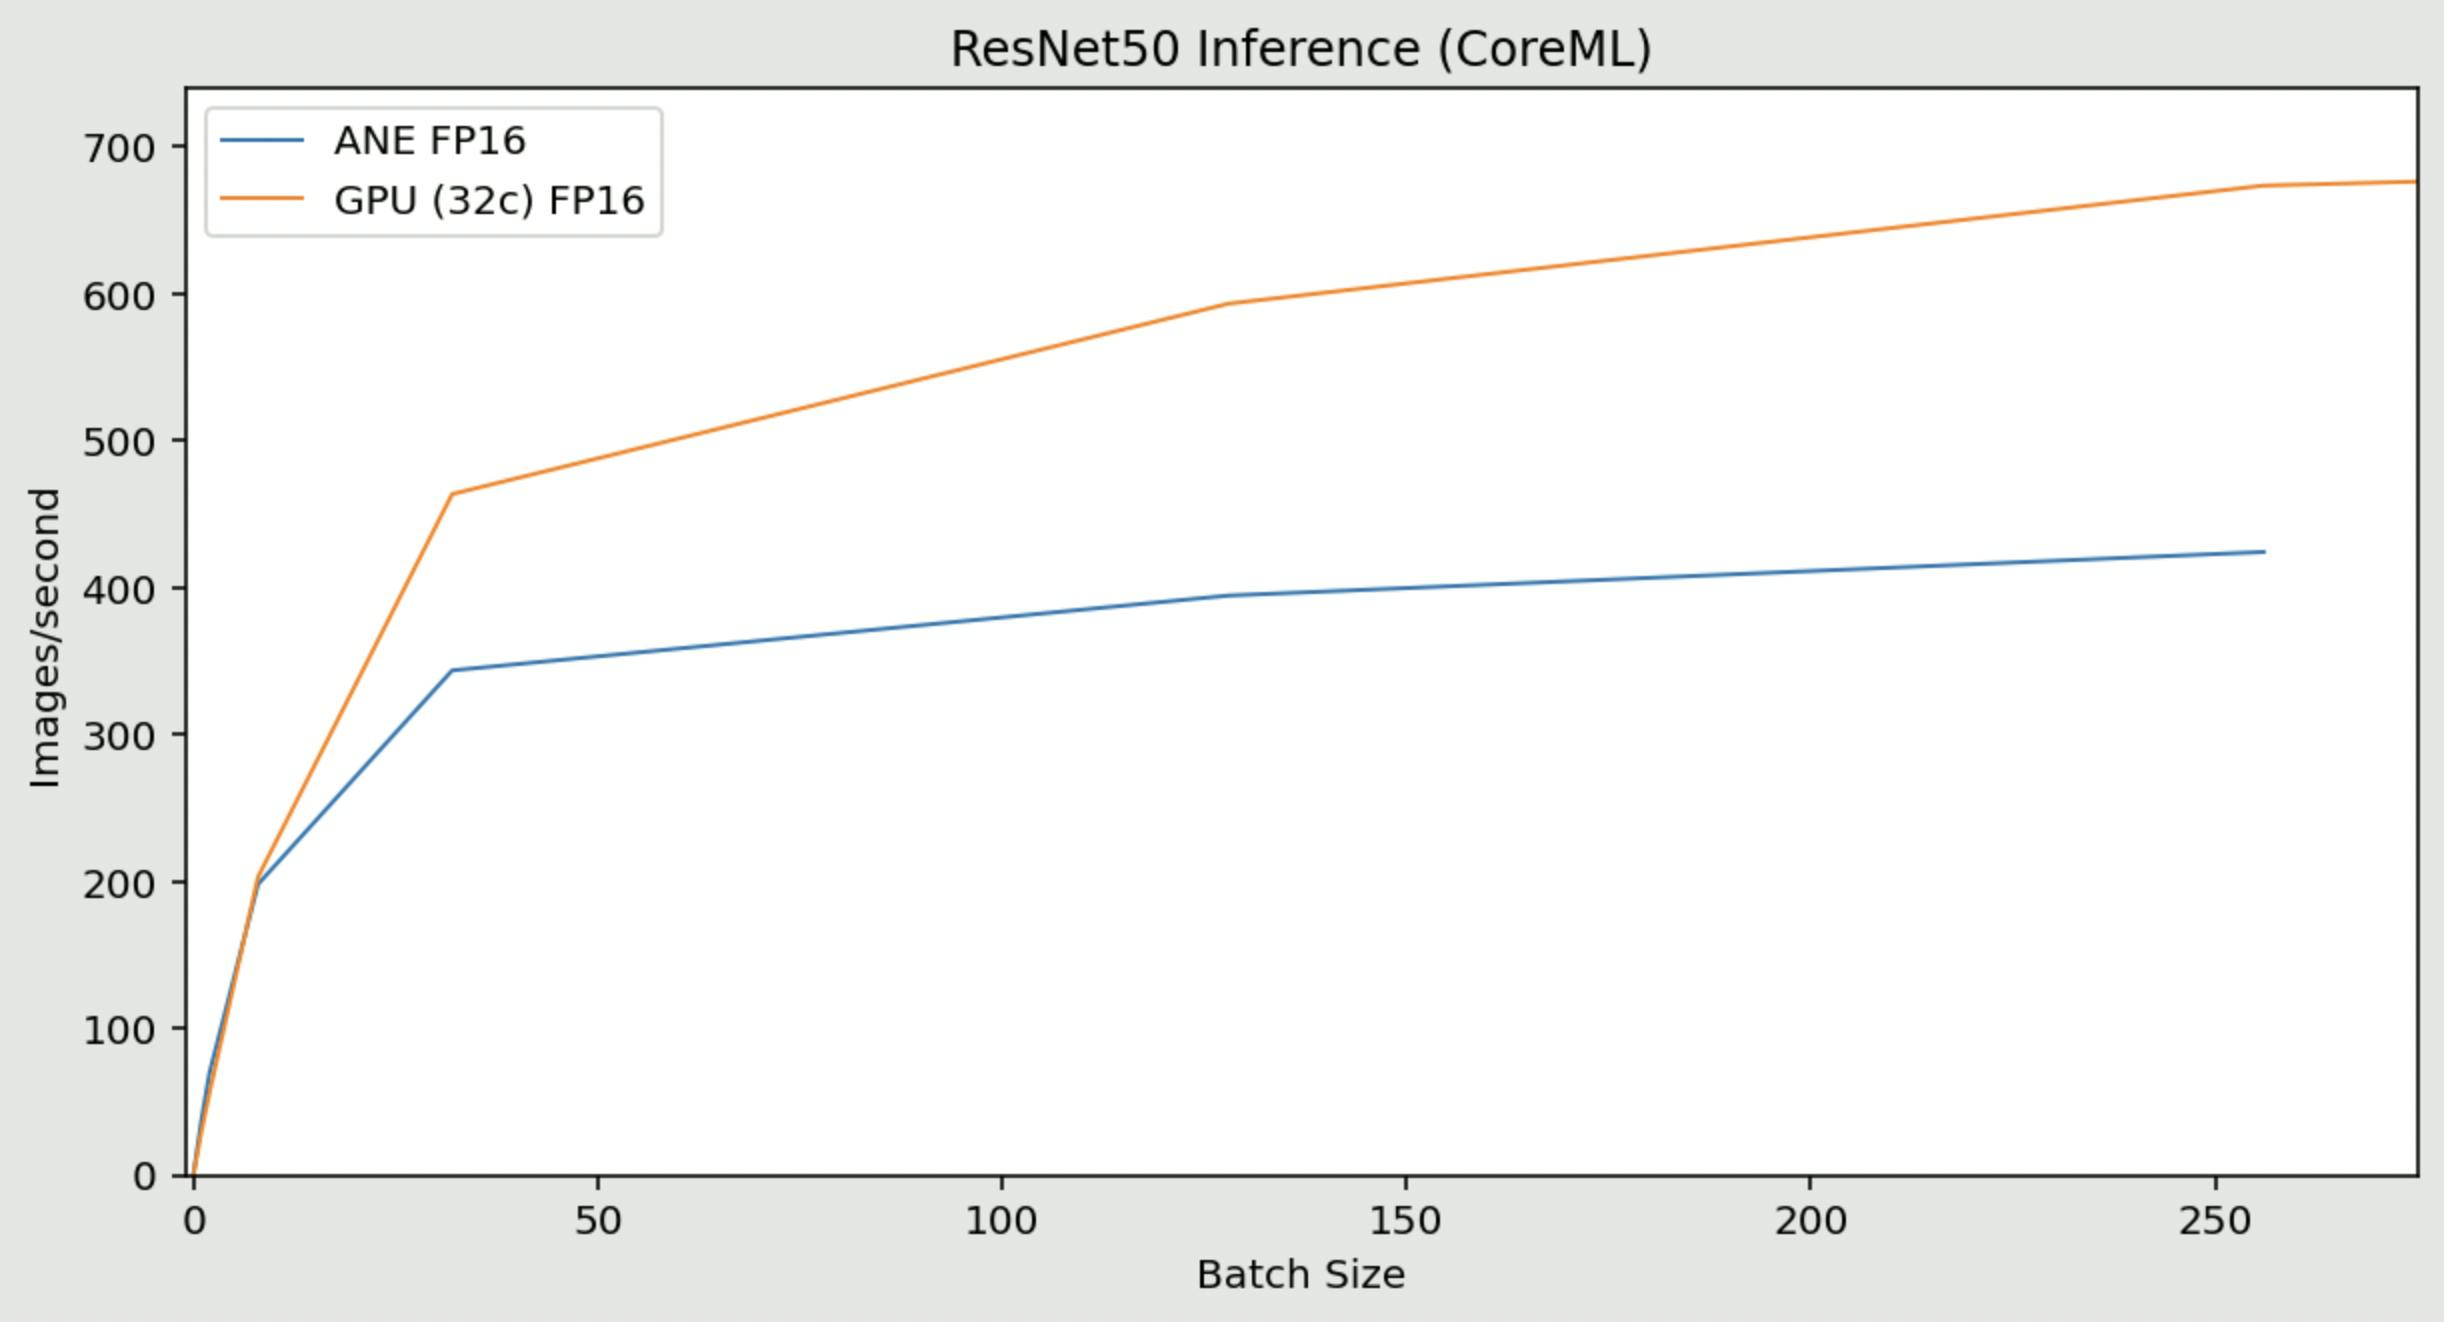
Key observations:
- At batch size <32, the ANE is faster
- At batch size 1, the ANE does ~38img/sec while the GPU does ~30img/sec
- At batch size 256, the ANE does ~424img/sec while the GPU does ~674img/sec
- At about 4 GFLOPS (estimated) per image, this is about 1.7 TFLOPS on the ANE and 2.7 TFLOPS on the GPU
- At batch size 512, CoreML does not use the ANE (it switches to the GPU instead)
Memory
The “Unified Memory” system on the M1-series of SOC is one of the most interesting things of the Apple Silicon architecture so far, allowing for not just a unified pool of memory resources, but also potentially zero-copy memory access between the CPU, GPU and other SOC components. On the M1 Max, the advertised memory bandwidth is 400 GB/s, much more than any other SOC on the market today! In fact, it is similar to a medium-range graphics card, but presumably because it is LPDDR5 instead of GDDR5/6, it has a lower latency and power consumption. The memory bandwidth is enabled by an actually crazy 512-bit bus.
CPU Memory Bandwidth
We can use the STREAM benchmark ( website is currently down, link to alternate source ) to measure peak memory bandwidth usable by the CPU.
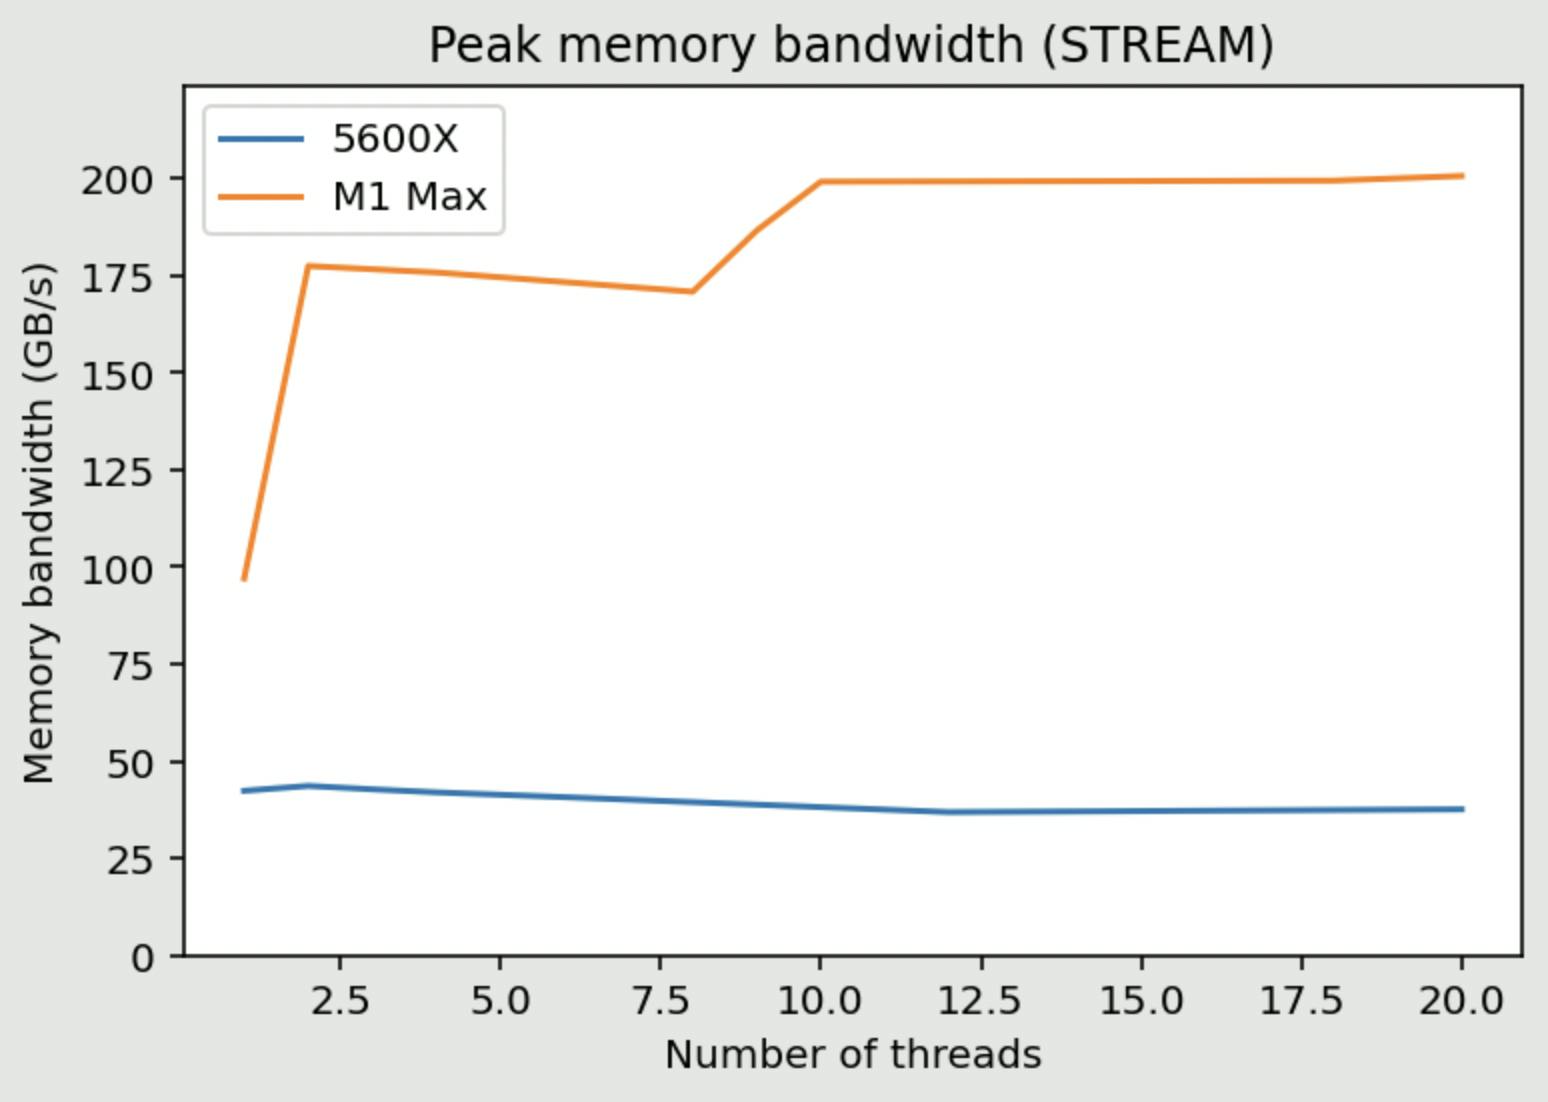
Yup, expected nothing less LOL. We can get about 200GB/s from the entire CPU complex. You can see the jump from single core/thread (about 90GB/s) to multiple threads saturating memory bandwidth from the entire P-CPU clusters, then to 10 threads saturating memory bandwidth from the entire CPU complex (with both the P-clusters and the E-cluster).
The observation here tracks with the memory-bound Pandas benchmark, where 10-thread works best on M1 Max and 2-thread works best on 5600X. In practice, not a lot of CPU tasks use such a high level of memory bandwidth, but when it does, the benefits are huge.
GPU Memory Bandwidth
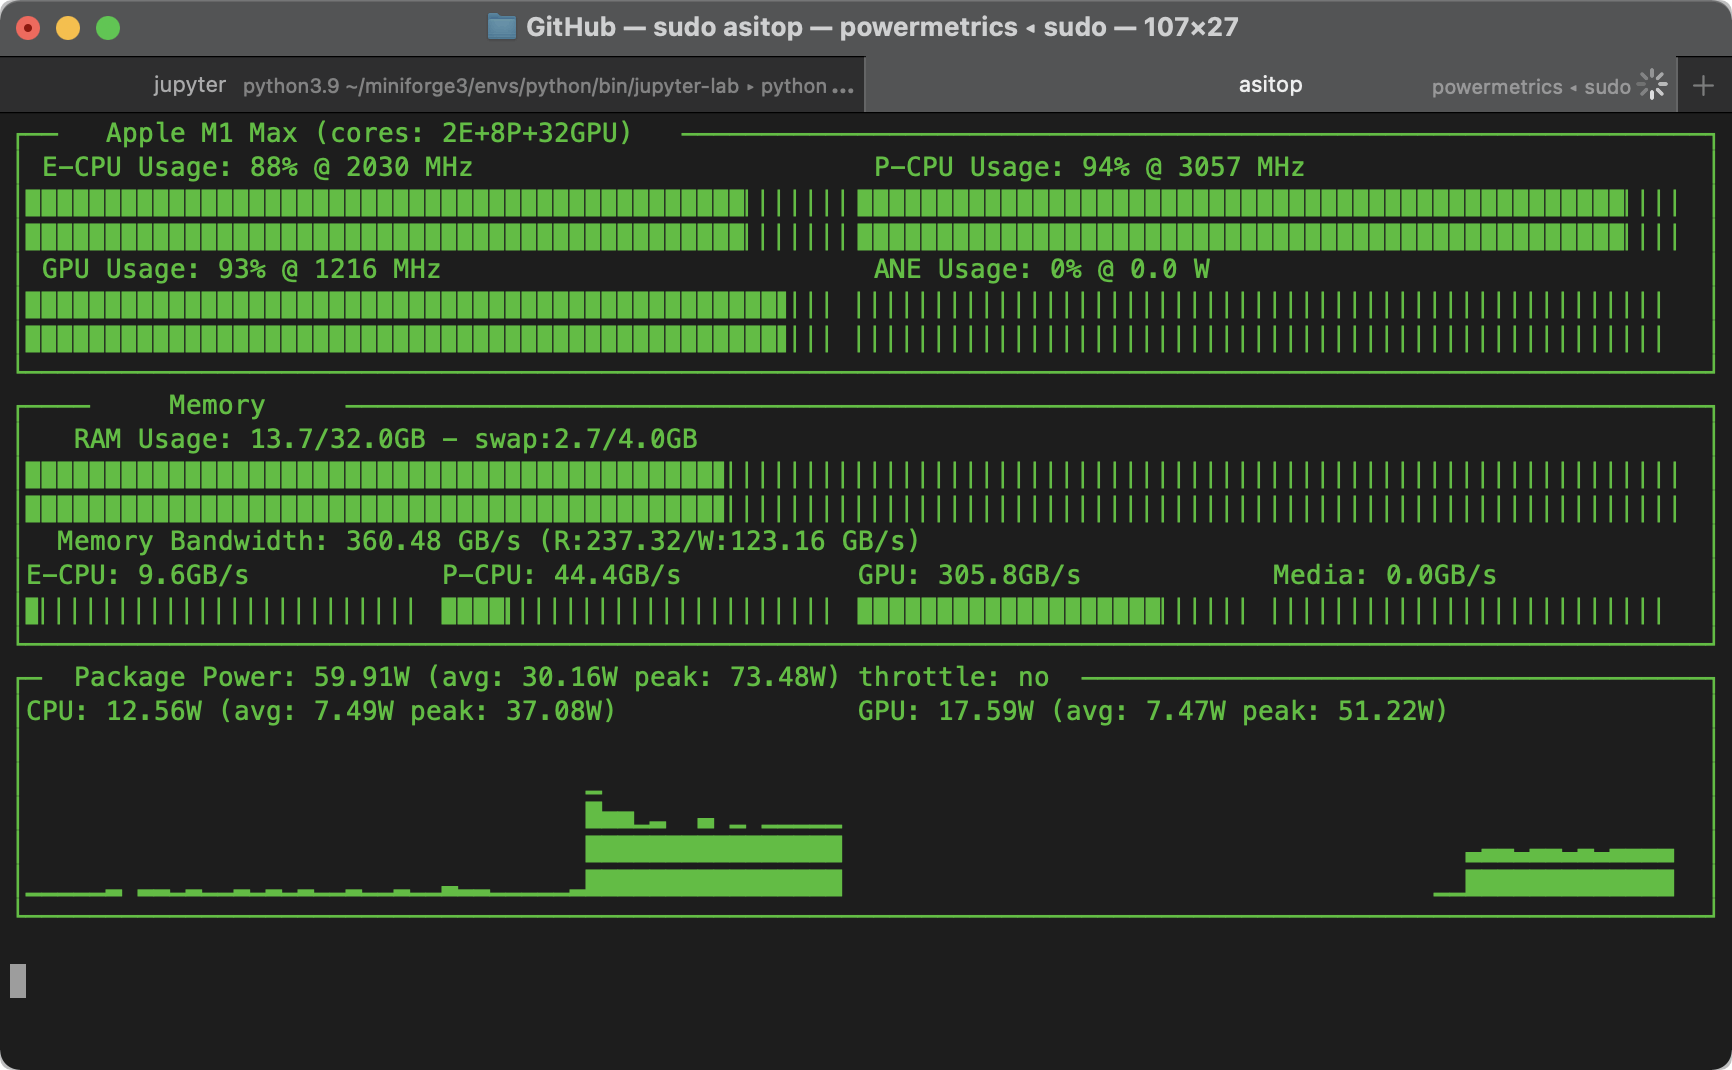
Again using TensorFlow, we can write a memory intensive benchmark similar to STREAM, and measure what we can achieve. By performing an element-wise multiply-addition operation on a large 8192×8192 matrix, we create an entirely memory-bound task (very low FLOPS), and we can look at the bandwidth counters from the powermetrics tool on macOS. We can observe about 330 GB/s of sustained bandwidth. In practice, training deep learning models seem to use between 200-300GB/s of memory bandwidth on average.
Combined Memory Bandwidth
So we can get about 200GB/s from the CPU, and about 330GB/s from the GPU. When we put them together, we can observe a combined bandwidth of 360GB/s, clearly some competition between the CPU and GPU. Below is the visualisation from asitop also showing the breakdown in bandwidth between the CPU clusters and the GPU, and other SOC components.
Zero-copy Memory Access
For this section, I wanted to test Zero-copy Memory Access via TensorFlow, which would be a reasonable application that can benefit from the unified memory architecture. However, it seems in the current build of TF-Metal, zero copy access is not working, maybe because the CPU parts are not executed in Metal.
For those curious, here are what the figures look like now (estimated from the throughput of the benchmark same as the GPU bandwidth test). The comparison system is a RTX 3090 connected to a 5600X via PCIE Gen 4 x16 (32GB/s theoretical bandwidth).
M1 MaxBandwidth5600X+3090Bandwidth
CPU -> GPU48 GB/sCPU -> GPU30 GB/s
GPU -> CPU19 GB/sGPU -> CPU19 GB/s
Package Power
- Idle: ~2W
- YouTube video on Google Chrome: ~3W
- MS Teams (Rosetta app), call with background blur: ~10W
- Package power seems to have a ~92W hard limit
- Fans hardly spin up from zero-RPM
Components Power
- CPU seems to consume up to 40W max
- GPU seems to consume up to 60W max, usually 40-50W during benchmarks
- ANE seems to consume no more than 8W max, usually much lower (2-4W during the ResNet benchmarks)
Benchmark Code
The code used to perform the benchmarks related to this blog post can be found in the GitHub repositories linked below. The benchmarks are performed mainly for my own curiosity, and thus may not have a high level of polish. In addition, some of the benchmarks were performed with some background applications running – I do not expect it to affect the benchmarks significantly, and this is not meant to produce the absolute best numbers for fanboys to fight it out. Sometimes the internet is scary ><
- CPU and some memory benchmarking code: https://github.com/tlkh/m1-cpu-benchmarks
- GPU, ANE, some memory benchmarks: https://github.com/tlkh/tf-metal-experiments
- Monitoring tool asitop: https://github.com/tlkh/asitop


