Japan Leads Per Capita App Store Spending at More Than $200 Per Person Since 2012
Ten years ago today, Apple launched the first version of its App Store for iOS. Since then, its apps have become an inextricable part of modern life—not to mention a major component of the global economy, creating more than 1.5 million jobs as of 2017 in the United States alone and contributing hundreds of millions of dollars to economies around the world. This is primarily driven by user spending on everything from iMessage stickers to monthly Netflix subscriptions, and totals more than $135 billion since the start of 2012.
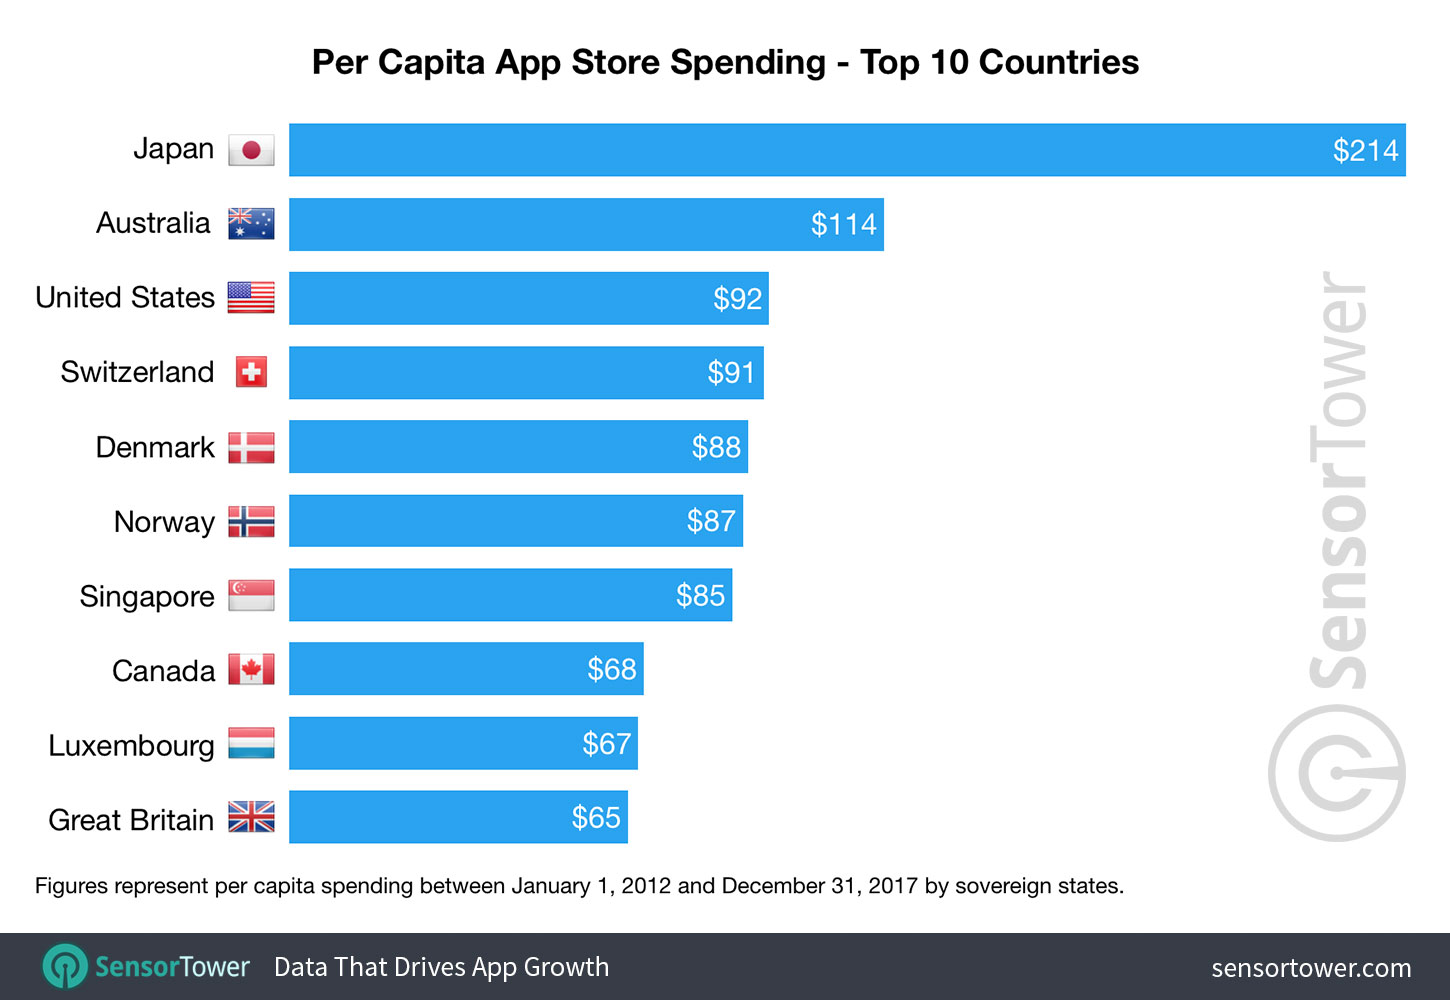
According to Sensor Tower Store Intelligence estimates, no country has contributed more to the App Store economy on a per capita basis than Japan, which spent an average $214 per person on paid iOS apps, in-app purchases, and in-app subscriptions between 2012 and 2017. In the following report, we reveal the 10 largest contributors to App Store revenue by per capita spending.
The Top 10
As can be seen in the chart below, Japan holds a commanding lead in per capita App Store revenue over second place Australia, spending about 88 percent more than that nation’s average of $114 per person since 2012.
All told, Japan spent more than $27.1 billion on iOS apps during the period we studied, with a population that totaled approximately 126.8 million last year. Australia spent about $2.8 billion during this period across its comparatively small population of approximately 24.6 million as of 2017.

Japan’s per capita spending for our analysis period was 132 percent more than the No. 3 ranked United States, which we estimate spent approximately $92 per person on the store during that time.
China, which spent a total of nearly $25 billion during the six-year period we studied, ranked at No. 23 due to its massive population of approximately 1.39 billion in 2017 driving down its per capita spending to $18. Other countries with more than $1 billion in user spending during our study period that didn’t make the top 10 included South Korea (No. 13, $41 per capita), France (No. 17, $29 per capita), Germany (No. 21, $26 per capita), and Russia (No. 28, $9 per capita).
Japan: No. 1 and Growing
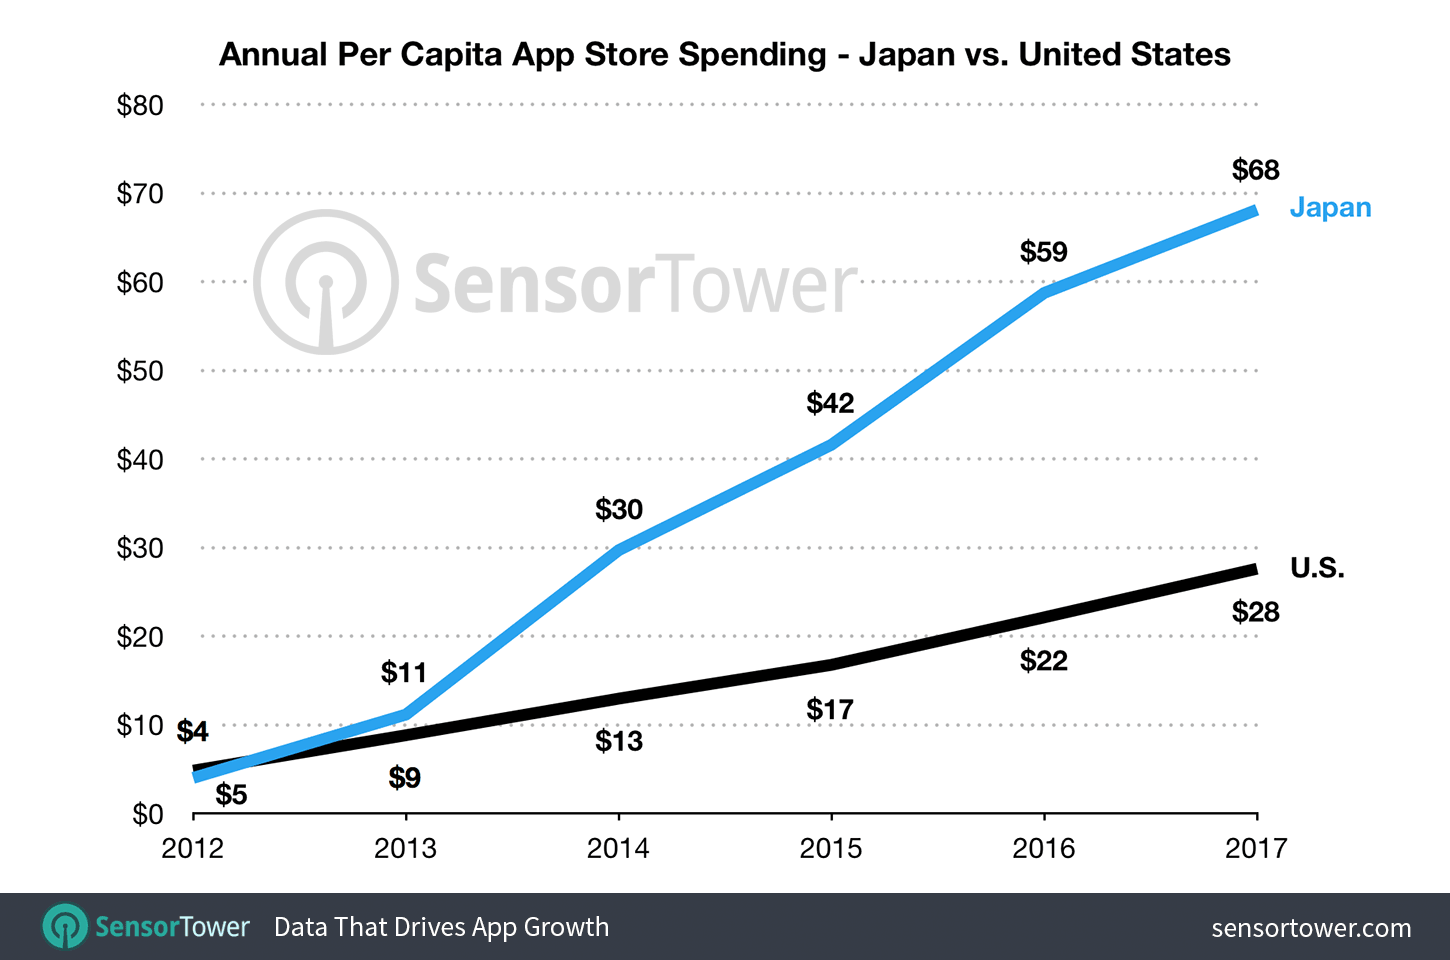
Focusing in on the spending leader, we see that Japan’s growth in per capita App Store revenue over the past six years has been nothing short of staggering. Below, we have compared its annual per capita iOS spending to that of the U.S.

In 2017, Japan spent about 143 percent more per capita than the U.S. at $68, versus the latter’s $28, with about 90 percent ($61) of that spent on Games category apps alone.
In 2012, the two countries spent nearly the same amount on the store per capita, with Japan contributing $4 to the U.S. average of $5. Since then, Japan’s per capita App Store spending has grown an average of 88 percent year-over-year, compared to 43 percent for the U.S.
More From the App Store’s First 10 years
Be sure to check back each day this week and follow us on Twitter for more from our weeklong look back at the first 10 years of Apple’s App Store. Next up: Discover which publishers have had the most No. 1 hits so far.
Sensor Tower’s App Intelligence platform is an Enterprise level offering. Interested in learning more? Request a live demo with our team!


