Framework for Facebook ads A/B testing
An inevitable fact of life is no matter how much you improve your ROAS, you’re guaranteed to run into posts on Facebook where others claim to have much better results than you.
This happened to me so many times and my reaction has always been the same—”I got to try this.” Sometimes they worked in a way, although I can’t say exactly why. Once a colleague of mine asked me how a recent change I did worked. The honest answer was—I had no idea.
Whenever someone mentioned the best way to scale Facebook ad campaigns was something like doubling the budget three times a day, I would do it. Then I’d get a few expensive days, my account CPA would skyrocket, and I’d just drop the idea and move on to the next one. Now I understand this approach was chaotic and the results were random.
Mục Lục
Shifting from luck to a framework
The ultimate goal of all tests is to improve a key metric. The first hard truth to accept is any test outcome is valuable as long as it answers the question, “should I roll out this change to the whole ad account?” even if that answer is “no.” And this is why my initial approach failed. It didn’t give me any answers at all.
After courses on basic and inferential statistics, private classes with a university professor of statistics, and dozens of shipped Facebook A/B tests, I’ve learned many lessons about them. Here’s the exact approach and tools I use to setup and run tests that tell the truth.
The 8 key elements of valid Facebook ads A/B testing
1. Pick the metric to measure success
Calculate the baseline conversion. The closer to the top of the funnel, the smaller sample is needed.
2. Define success up-front
Estimate the minimum detectable effect.
3. Define the right sample size
Use a sample calculator. Set statistical power to 80% and significance level to 5%.
4. Define the budget
Multiply sample size by the cost per unique outbound click.
5. Define the period
Usually 2+ weeks. Based on the share of monthly budget you can allocate to the test.
6. Split your sample groups equally and randomly
Set up two rules in Revealbot that will randomly split ad sets into test and control groups.
7. Describe the test
Write down how you’ll manage the test group. Preferably set it up in the rules.
8. Monitor equal reach between test and control groups
Shares may skew over time. Keep the reach in both groups equal.
Pick the metric to measure success
My main KPI has always been CPA (cost per acquisition). All the brands that I’ve worked with have always been very outcome-driven. Testing any proxy metric, such as CPC or CTR didn’t make much sense, because decrease in CPC does not necessarily lead to decrease in CPA.
I would define the baseline conversion as Purchases divided by Unique outbound clicks, the latter represents the number of people.
Define success up-front
Another important step is the minimum detectable effect—the change in the metric you want to observe. This will tell you the sample size you need. The smaller the effect the more people you need to reach.
For example, if the CPA is $50, it means the conversion rate is 1.84%. I want to detect a decrease in CPA to $40, which equals increase in conversion to 2.30%. The minimum detectable effect would be 0.46%, 2.30% minus 1.84%
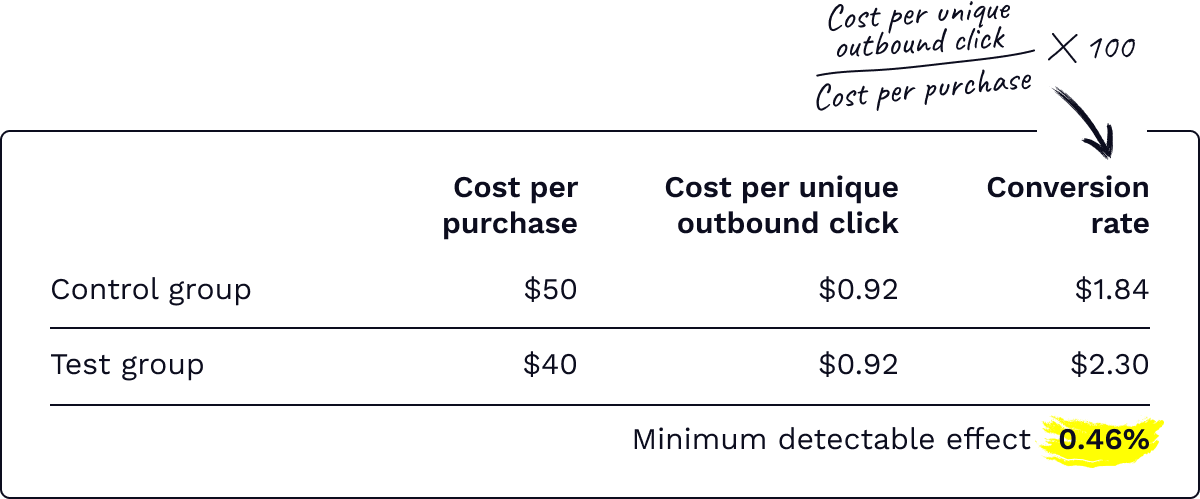 Calculating the minimum detectable effect
Define the right sample size
Power and statistical significance
A question always arises when analyzing test results, “is the observed lift in conversion a result of the change that I made or random?”
Linking the uplift in conversion to the tested change when in reality it is not is related the false positive. To reduce the chance of reaching a false positive, we can calculate the statistical significance, which is a measurement of the level of confidence that a result is not likely due to chance. If we accept that there is a 5% chance the test results are wrong (accepted false positive rate), the statistical significance, therefore, is 100% minus 5%, or 95%. The higher the statistical significance the better as that means you can be more confident in your test’s results and 95% is the recommended level of significance you should strive for.
The other type of error that may occur in a test is called a false negative. It refers to the probability of reaching a negative result when in fact the test should have been positive. To reduce the chance of reaching a false negative, statisticians measure the statistical power, which is the probability that a test will correctly reach a negative result. The power is equal to 100% minus the false negative rate. It is generally accepted that the power of an A/B test should be at least 80%.
Calculating the sample size
The minimum detectable effect, power, and statistical significance define the sample for your test. Thanks to the power of the Internet there is no need to do it by hand anymore. There’re many free calculators out there but I’m using this one.
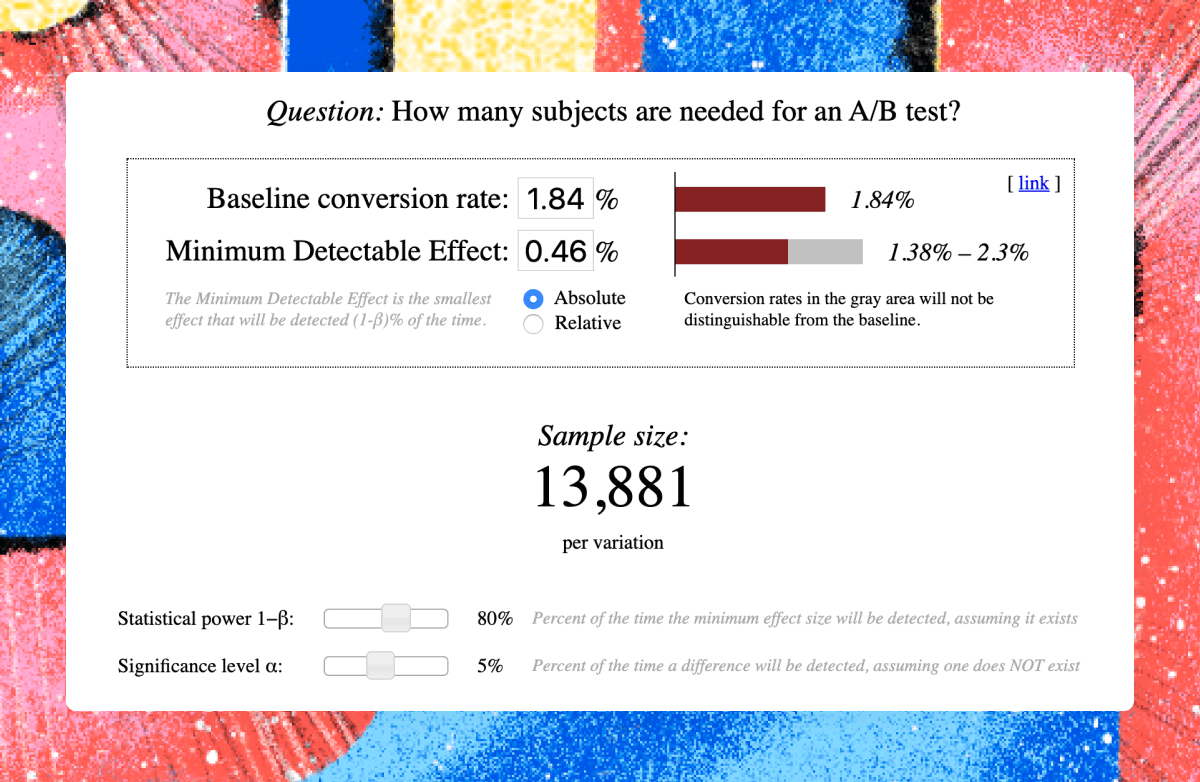 Evan Miller’s sample size calculator
To detect the desired effect I’ll need 13,881 people in each variation, meaning 27,726 people in total.
Define the budget
Knowing the required sample size, you can estimate the budget for the test. My average cost per unique click is $0.92, so the budget will be 27,726 unique outbound clicks multiplied by $0.92, which equals $25,541.
Define the period
A test usually runs for at least two weeks but can be active for several months. Both the control and test groups should be live at the same time so other factors don’t influence the test results.
Tests can be expensive and I like calculating the period based on the share of budget I can afford to allocate to the test.
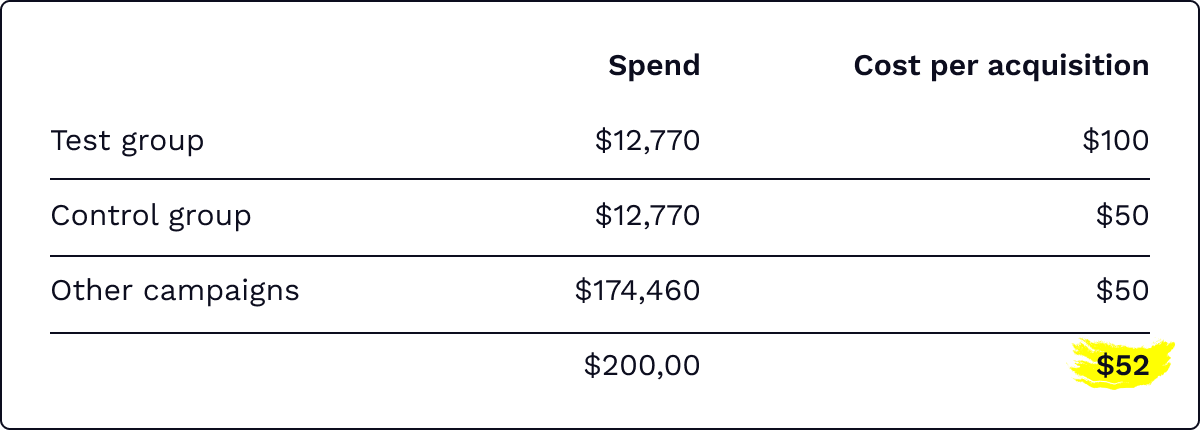
To do that, I consider the worst possible outcome—for example if the conversion rate drops by 50% in the test group. Let’s see what will happen with the total ad account’s CPA in this case.
Let’s assume my monthly ad spend is $200k and my target CPA is $50. If my test fails and conversion rate decreases to half its current value, my ad account’s total CPA will increase to $52. If this outcome is fine, then I don’t need to run the test for more than two months. I could complete it within 2-4 weeks, but I’d prefer a longer period, so, in this case, four weeks.
Split your sample groups equally and randomly
That’s a tricky one. There is no way to get two equal non-overlapping audiences in Ads Manager without the Split Test tool. The Split Test tool in the Ads Manager allows you to split an audience into several randomized groups, then test ad variations, placements, and some other variables. In my experience, these tests have always been much more expensive than I was ready to spend on them. They won’t let you test strategies as well, because you cannot make any changes to the test after it has been set live.
Knowing that Facebook’s split tests don’t work for me, I found a workaround. I can just randomly assign ad sets to either the test or control groups. I decided to ignore that someone might belong to the test and control groups at the same time if the sample is big enough.
I might add my own bias if I choose to group the ad sets myself into either the control or test groups, so instead I can let a program do it. I used Revealbot’s Facebook ad automation tool to assign one-half of ad sets to a test group and the other to the control group. Here’s how I did it:

Problem solved.
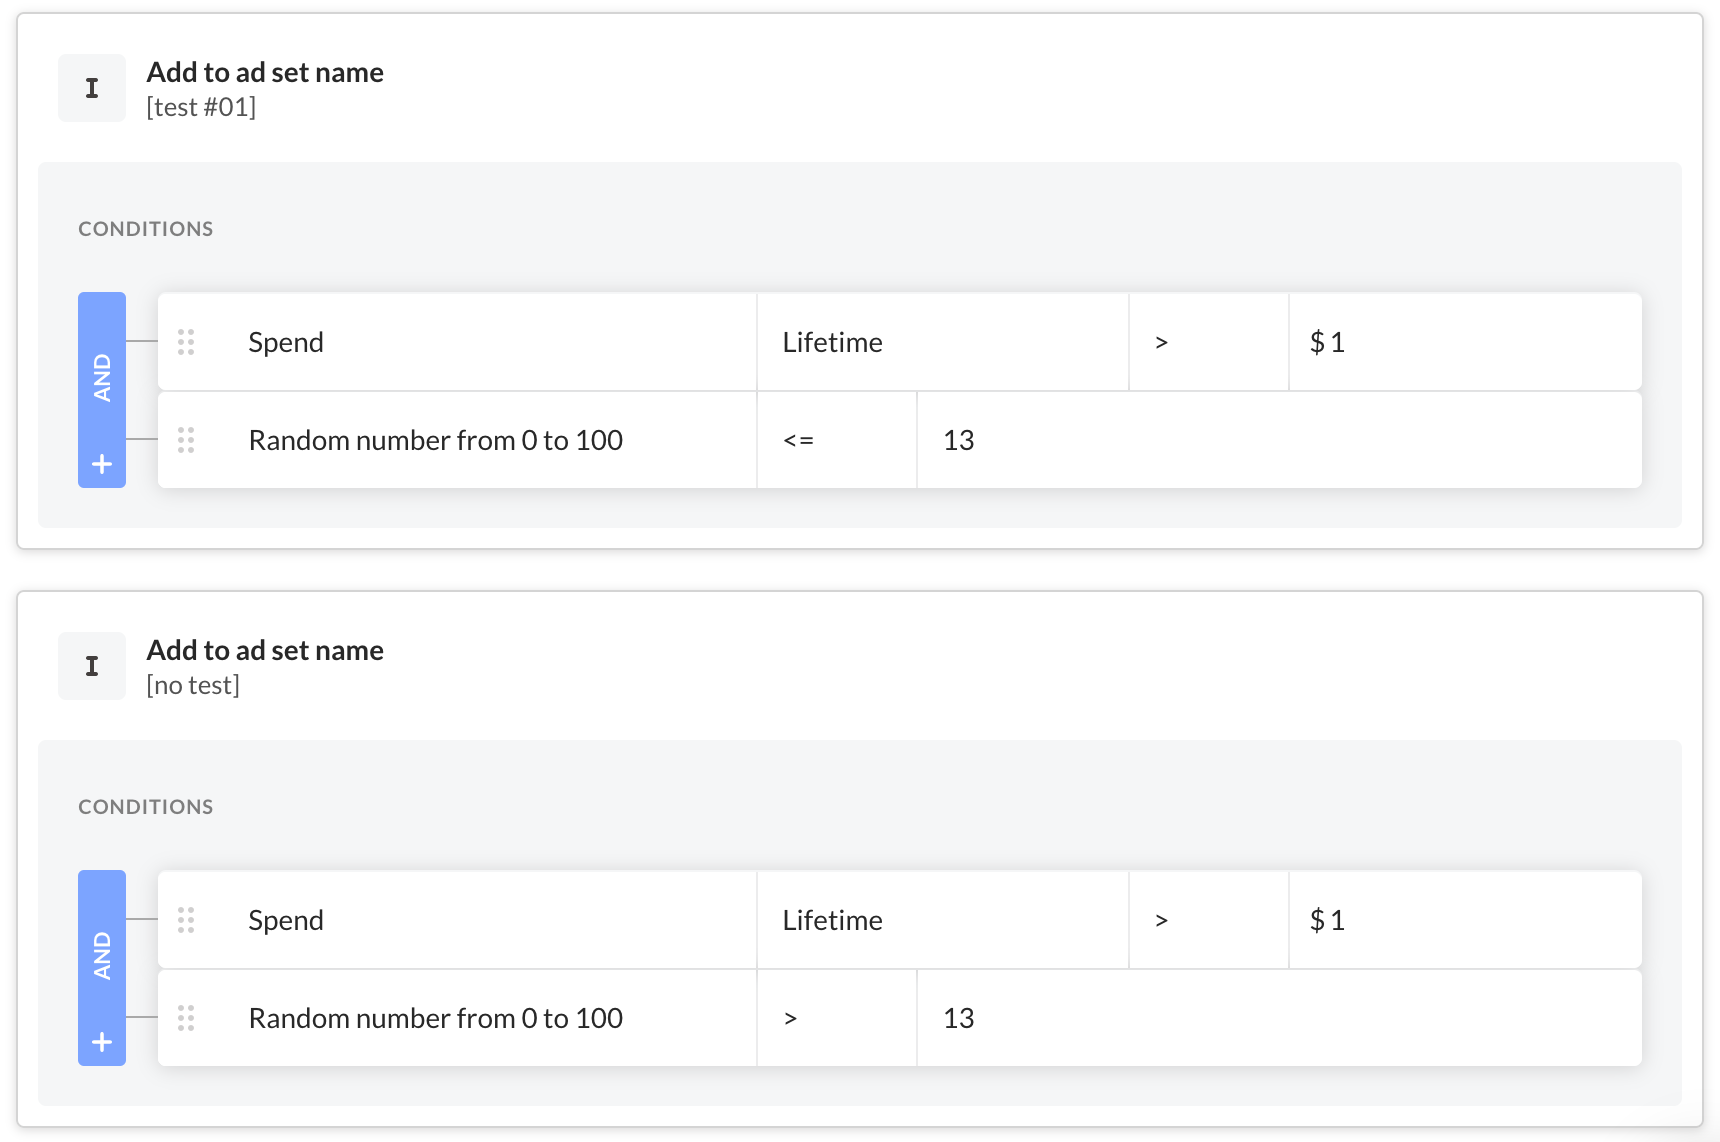
But before splitting ad sets to the test and control groups, let’s create one more rule that will limit the number of ad sets in the test. In the previous steps, I’ve estimated the total test budget to be $25,541, which is 13% of the total monthly budget ($200,000).
The following rule will assign 13% of all new ad sets to the test.
 Add this strategy to my account 🙌🏻
Follow this link to add this Revealbot Strategy to your account. If you don’t have Revealbot, you can get a free trial, or you’ll just have to pick the ad sets yourself and try your best to do it randomly to keep the test pure.
Describe the test
Determine how you’ll manage the test group. It should be a clear instruction that covers all scenarios. This is how a description could look like:
Observation
Ad sets on automatic bidding that have grown to a $2,000+ daily budget quickly drop the ad account’s performance if their conversion rate goes below 20% of the target value. Lower conversion always results in higher CPA. If I observe high CPA for three consecutive days, I substitute the ad set with a new one with an identical audience. While the new ad set has a significantly lower daily budget, the purchase volume on the ad account decreases.
Hypothesis
If I decrease the budget to $1,000 a day, the ad set will restore the target conversion rate and the ad account purchase volume will decrease less.
Test scenario
1. If an ad set’s daily budget is greater than $2,000 and its conversion rate over the past three days including today is .8 of the target value, add “[downscale test]” to the ad set’s name.
2. If an ad set has “[downscale test]” in the name, add “[test group] ” to its name with a 50% probability.
3. If an ad set has “[downscale test]” and “[test group]” in the name, set its budget to $1,000 daily.
4. Check the conversion rate for each ad set five days after the downscale.
Preferably setup the test in automated rules.
Don’t want to bother with testing?
Revealbot Strategies are plug-and-play automation strategies to launch experiments fast
Sign up free
✓ 14-day free trial ✓ No credit card required ✓ Cancel anytime
Monitor the test’s health
Check the reach of the test and control groups regularly. Ad spend is volatile and may cause unequal budget allocation and therefore unequal reach to each group of the test. If this happens, even them out by changing how each group tag is assigned.
It seems like a lot of heavy lifting, but it’s just in the setup. Tests require time and budget. This is why it’s important to prioritize what you want to test first and define which hypothesis could drive the biggest impact. To reduce the cost, try detecting a bigger effect but never sacrifice power or significance for the sake of the cost of the test.
Ideas for tests
- Am I pausing ads too early? What will happen if I pause ad sets later?
- If I decrease the budget of ad sets that became expensive but once were top-performers will they perform well again?
- What if I scale campaigns more aggressively?
Have you done tests before and if so, how did they turn out?


